

Chart of the Day - December Silver
The information and opinions expressed below are based on my analysis of price behavior and chart activity
Tuesday, October 14, 2025
If you like this article and would like to receive more information on the commodity markets from Walsh Trading, please use the link to join our email list -Click here
Every morning, at about 8 AM CST, I post a short video highlighting where I see opportunities in the futures markets. You can view my most recent video here
December Silver (Daily)
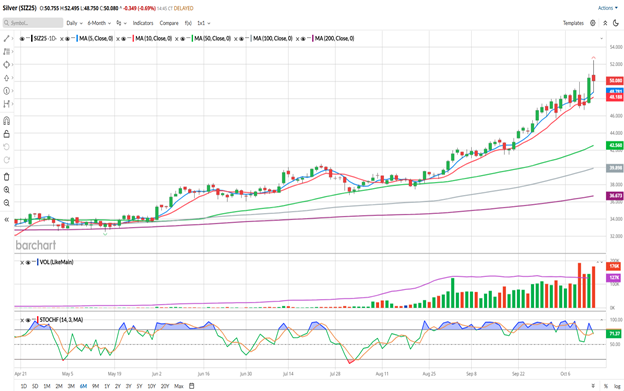
As of this writing, December Silver is trading at 50.310, down 0.119 on the day. (This market is one of the “weird” ones, in my opinion, as it posts an official settlement price at or about 12:35 PM CT but trades until 4 PM CT. It is my understanding that it’s a nod to the OG floor traders.) New contract highs were set early in today’s session (read as: late last night), but a bout of profit taking ensued overnight and the daily low of 48.750 was made at about 1:20 AM CT. That low was a test of the 5-day moving average (blue, 48.828) and marks 6 consecutive sessions that average has been hit. Over the past 10 days, that number is 8, not consecutively, indicating a level of support to my eye. Prices have rallied over the big, fat, round number of $50.000, which was a long-standing price target for many market participants, in my opinion. Does that become permanent support now? Perhaps, I believe that many folks are still very bullish and are still very willing buyers. Probably not in the long run, as very little in the futures markets is permanent. And if more long traders decide to take profits this week, perhaps not for very long.
Higher highs and higher lows for both trading days this week, indicates that the uptrend is still intact. Today’s weakness may have been another instance of “Turnaround Tuesday” type trade. Monday’s close was very strong, not very far from the highs of the session and prices did trad higher today. Volume was high today, eclipsed only by the trade volume from last Thursday, which was also a “down” day. The difference in today’s trade is that we’re finishing the day over $1.50 off of the lows, as opposed to just $0.267 last Thursday.
The moving averages displayed above are all in bullish territory and are below the market price. The 5- and 10-day averages (blue/red, 48.824 and 48.210, respectively) appear to have acted as good support since late August. The 50-day average also offered support when it was tested 2 times in August. The 100-day and 200-day averages are near 39.900 and 36.674. All of the moving averages are inclined and pointing toward higher prices, still. If those longer-term averages are tested, we may have seen a bearish trend shift.
Stochastics (bottom sub-graph) have just come out of overbought status with today’s trade. Looking back over this chart, you might see that overbought has been the case for most of the life of this chart view, with oversold only being achieved on 3 trading days going back to April.
Silver prices have had a strong run higher. And while I see nothing on the chart that tells me it’s over, the breach of $50.000 may spur selling pressure and profit taking. Silver hasn’t had any type of significant setback or consolidation since July (the last time it was oversold) and is certainly “due” for one. Since the trend resumed higher in August, the market has not strung together more that 2 down, or red days, consecutively.
Aggressive and well-margined traders may do well to consider establishing long futures positions. I would advocate for placing orders to buy near support Perhaps near the 5-day or 10-day moving averages or against the middle of last week’s range, near 48.330. As I don’t know your account size or your risk tolerance, I’ll leave the entry and protective sell-stop levels up to you. For an upside target, for now, I’d suggest setting something near the 55.000 level, as this market seems to like big, round numbers.
There are also Mini and Micro contracts available to trade, with the Micro contracts usually having the highest trading volume and greatest liquidity. The Micro Silver volume today even exceeded the full contact volume, and if my memory serves, that’s a pretty common occurrence, if not daily.
Less aggressive traders may do well to consider long Call Option positions. You’ll still need to be well-capitalized, as the nearest options are nearly $15,000 before tour commissions and fees. Again, I’ll leave the strike price selection up to you, but I would suggest placing GTC orders at 2x what you paid for the options, as these markets can be very volatile. Call me if you need suggestions.
If you like what you’ve read here and would like to see more like this from Walsh Trading, please Click here and sign up for our daily futures market email.
Every morning, at about 8 AM CST, I post a short video highlighting where I see opportunities in the futures markets. You can view my most recent video here
December Silver (Weekly)
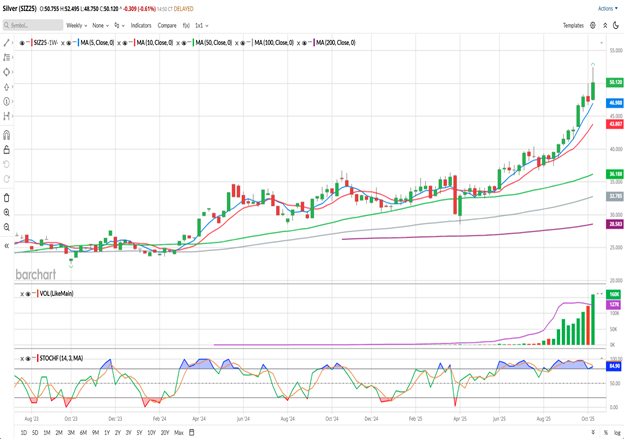
As of this writing, December Silver has posted a trading range of $5.07, from low to high. And it’s only Tuesday. Looking back over this chart, I can only see one week, the first week in April of this year, where the market had a larger range. That week, the market traded in a range of $6.11, from low to high, but that was a “down” week for the market. That week, prices dropped by $5.369. New contract highs were set this week, but prices are well off the weekly highs, as some traders took profits. This weekly chart shows the market trading well above the 5- and 10-week moving averages (blue/red, 46.999 and 43.815, respectively) and those levels may offer support for patient market participants. Those moving averages have been in a bullish configuration since the last week in May. They’ve been tested as support 10 times since then, specifically the 5-week, and the 10-week average has been tested during 4 of those weeks. Until now, that support has held and the uptrend has been maintained. Trade volume this week (middle subgraph) has exceeded the trade volume previously, according to Barchart’s data. My other data sources don’t reflect that increase. Stochastics (lower sub-graph) remain in overbought territory and they’ve been that way for about 2 months or so. You may notice that this market has been content with being more overbought than oversold, over the life of this view. The long-term moving averages displayed are well below the market, with the closest being the 50-week average (green, 36.192). The 100 week- (grey) and 200 week- (purple) are below that average, as well. The 100-week held as support when it was last tested in April, but I think that if Silver prices head back down to any of those, the trend will have changed from bullish to bearish.
I’m not certain that seasonal tendency has any bearing on the current trade, but for those interested, you can find Barchart’s Seasonal Data here. According to the data there, prices rally in October 75% of the time over the past 15 years, while they turn lower almost 75% of the time in November. December is closer to 50/50, with a slight advantage to the bulls.
If you like what you’ve read here and would like to see more like this from Walsh Trading, please Click here and sign up for our daily futures market email.
Every morning, at about 8 AM CST, I post a short video highlighting where I see opportunities in the futures markets. You can view my most recent video here
Jefferson Fosse Walsh Trading
Direct 312 957 8248 Toll Free 800 556 9411
jfosse@walshtrading.com www.walshtrading.com
Walsh Trading, Inc. is registered as a Guaranteed Introducing Broker with the Commodity Futures Trading Commission and an NFA Member.
Futures and options trading involves substantial risk and is not suitable for all investors. Therefore, individuals should carefully consider their financial condition in deciding whether to trade. Option traders should be aware that the exercise of a long option will result in a futures position. The valuation of futures and options may fluctuate, and as a result, clients may lose more than their original investment. The information contained on this site is the opinion of the writer or was obtained from sources cited within the commentary. The impact on market prices due to seasonal or market cycles and current news events may already be reflected in market prices. PAST PERFORMANCE IS NOT NECESSARILY INDICATIVE OF FUTURE RESULTS. All information, communications, publications, and reports, including this specific material, used and distributed by Walsh Trading, Inc. (“WTI”) shall be construed as a solicitation for entering into a derivatives transaction. WTI does not distribute research reports, employ research analysts, or maintain a research department as defined in CFTC Regulation 1.71.